What teachers see: a class dashboard built on methods, not labels
A teacher can now make a class for any shelf, share a six-letter code, and see how each student is doing: what they've mastered, how much they studied each day, and who needs a hand. The dashboard also shows which study methods are working across the class. Here's what it shows, what it leaves out, and why.
Why give teachers data at all
Information about where students are only helps if a teacher acts on it, but when they do, it helps. Formative assessment has a real, modest effect: a meta-analysis put it at about 0.2 standard deviations, smaller than earlier estimates but consistent (Kingston & Nash, 2011, with the 2015 erratum). A randomized trial across 59 districts and more than 500 schools gave half the districts quarterly benchmark data plus training in using it, and maths scores rose significantly (Carlson, Borman & Robinson, 2011). An early-warning system tested in 73 high schools cut chronic absence from 14% to 10% and course failure from 26% to 21% (IES, EWIMS study).
Dashboards themselves are no magic. A review of learning-analytics dashboards found they are "rarely grounded in learning theory" and poorly evaluated (Matcha et al., 2020). So ours is deliberately small: a few signals a teacher can act on the same day.
For each student
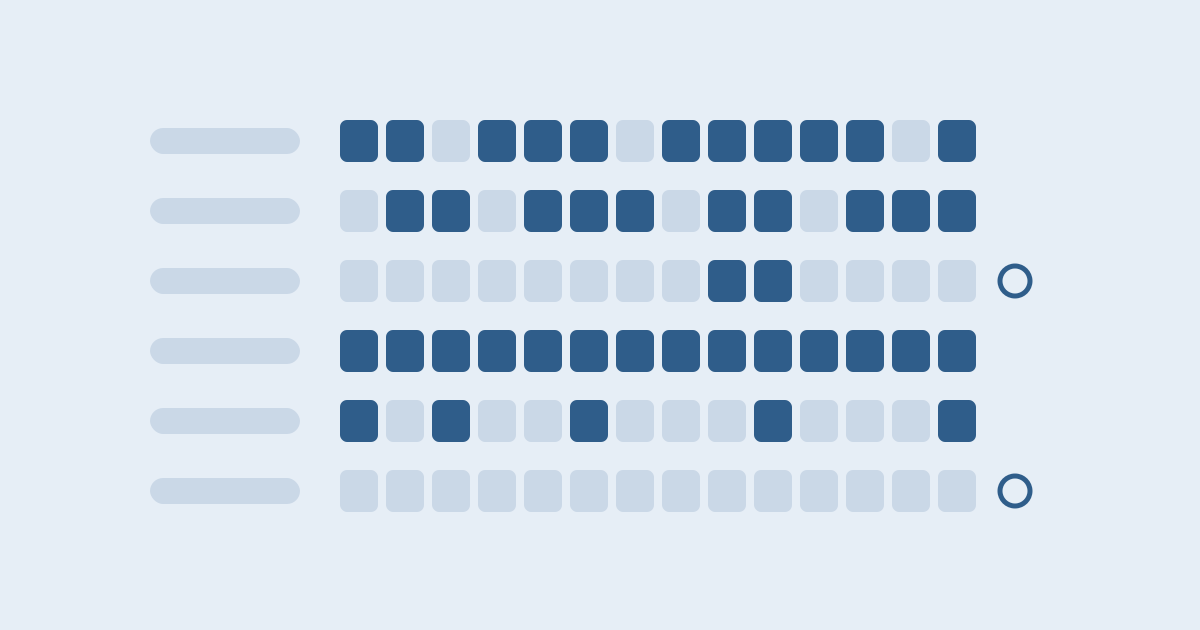
- Daily activity: minutes studied on the shelf for the last 14 days, as a strip of squares, plus minutes and active days this week.
- Progress: chapters mastered, the chapter they're on, and their latest mastery-check score.
- What works for them: the study methods measured as working, or not working, from their delayed check-ins.
- Flags: Struggling (two or more checks on the current chapter, or a failed check under 60%), Inactive 3+ days, Not started.
The early-warning trial used attendance and grades, not app activity, so treat "inactive" as a nudge to check in, not a prediction.
For the class
- Daily minutes and how many students studied each day.
- Chapters: how many have mastered each one, and how many passed its check first time. A chapter most of the class fails first time is a chapter to reteach.
- Most-missed ideas from mastery checks, ranked by how many students missed each.
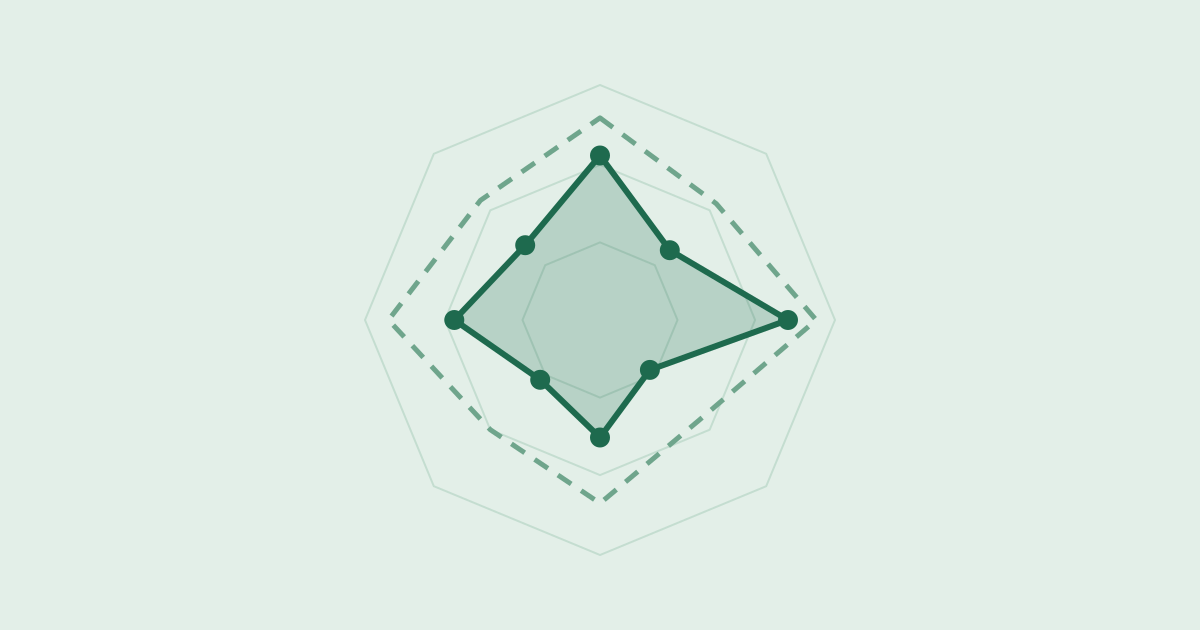
- What's working for this class: each of the seven method types, with the share students remembered at check-ins a few days later.
Methods, not learning styles
The dashboard never sorts students into "visual" or "auditory" learners. Studies with a proper design "flatly contradict" the idea that matching teaching to a learning style helps (Pashler et al., 2008). What does differ is how well methods work: practice testing and spaced practice rate highest, rereading and highlighting low (Dunlosky et al., 2013). So we measure methods, for each student and for the class, on unaided check-ins days after studying. A class-wide verdict needs at least 15 check-ins from 3 or more students; until then it says "too little data".
Students choose to share
Students are cautious about sharing data for learning analytics, and researchers recommend involving them in the decision (Ifenthaler & Schumacher, 2016). So before a student joins, they see exactly what the teacher will and won't see, and they must agree. The teacher never sees what a student writes, or anything from other shelves. Students can leave at any time, and sharing stops at once. Every time a teacher opens the dashboard, it's logged, and the student can see that log.
How this connects to our solution
- Belief 1: "A teacher's time belongs to students." The dashboard points at who and what needs attention, so the time goes there.
- Belief 9: "Measure what works for each learner; never label them." This post is the class-sized version.
- In the product: Teach in the main menu; the join page students see.
- Call to action: Make a class · See how we protect student data